joeyi
WHITE PAPER · OCTOBER 2026
Oracle Brain for eAM
Live asset intelligence from Oracle EBS.
Every work order, purchase order, invoice and journal behind your equipment already lives in Oracle. The hard part has never been storing that data. It is seeing it, connecting it, and trusting it. Oracle Brain watches the full asset lifecycle in Oracle EBS, live and read-only, and puts it in front of you with every figure traced back to its source.
- What it is
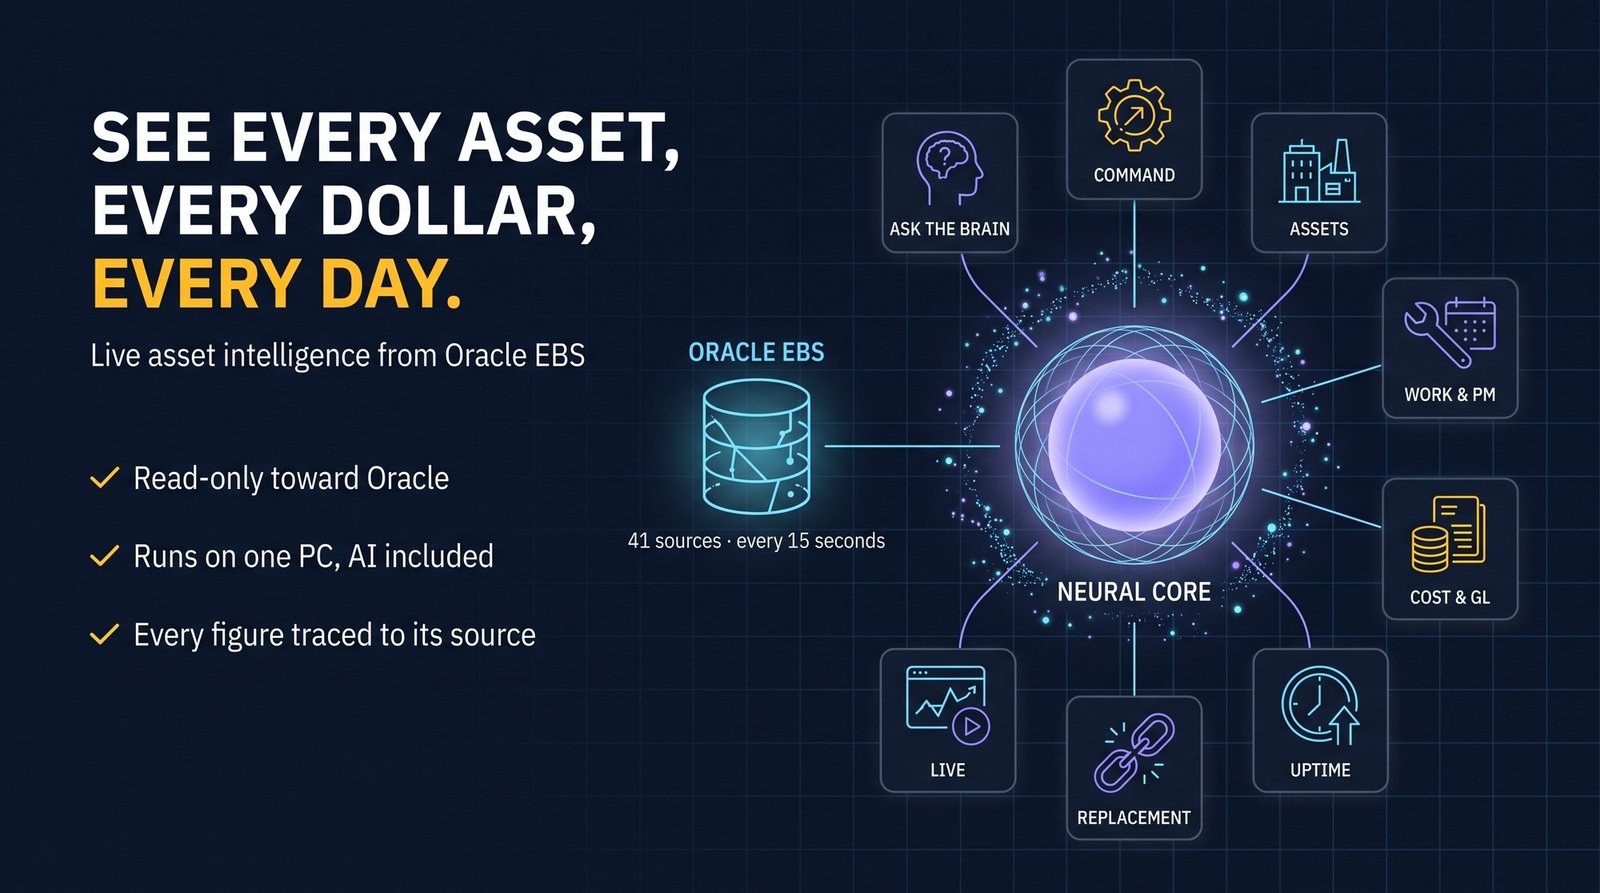
- Live asset intelligence over Oracle EBS eAM: it reads forty-one Oracle sources, checks for changes every fifteen seconds, and never writes back.
- What it shows
- Command, assets, work, preventive maintenance, procure to pay, stock, cost and GL, fixed asset lifecycle, uptime, replacement scoring, live events and checks.
- Where it runs
- On one machine. Its AI runs locally, and nothing leaves that PC except an optional alert with counts and a link.
- How you trust it
- Read-only toward Oracle, AI that is advisory only, automated tests, and reconciliations that run continuously.
The problem
The data behind a fleet is already in Oracle: the work orders, the purchase orders, the invoices and the journals. What a maintenance leader lacks is one place that connects them and can be trusted in a meeting, without exporting six screens into a spreadsheet.
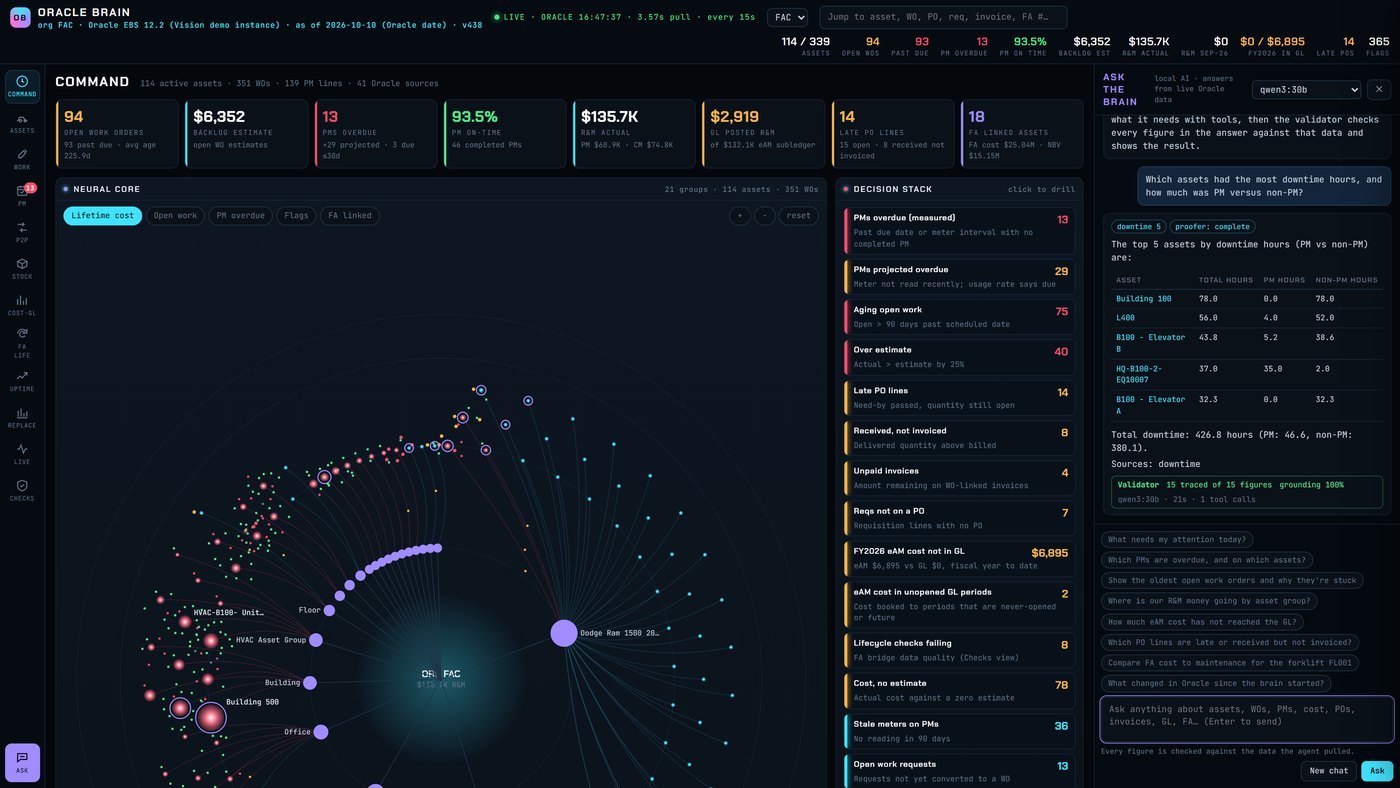
Command: what needs attention, ranked
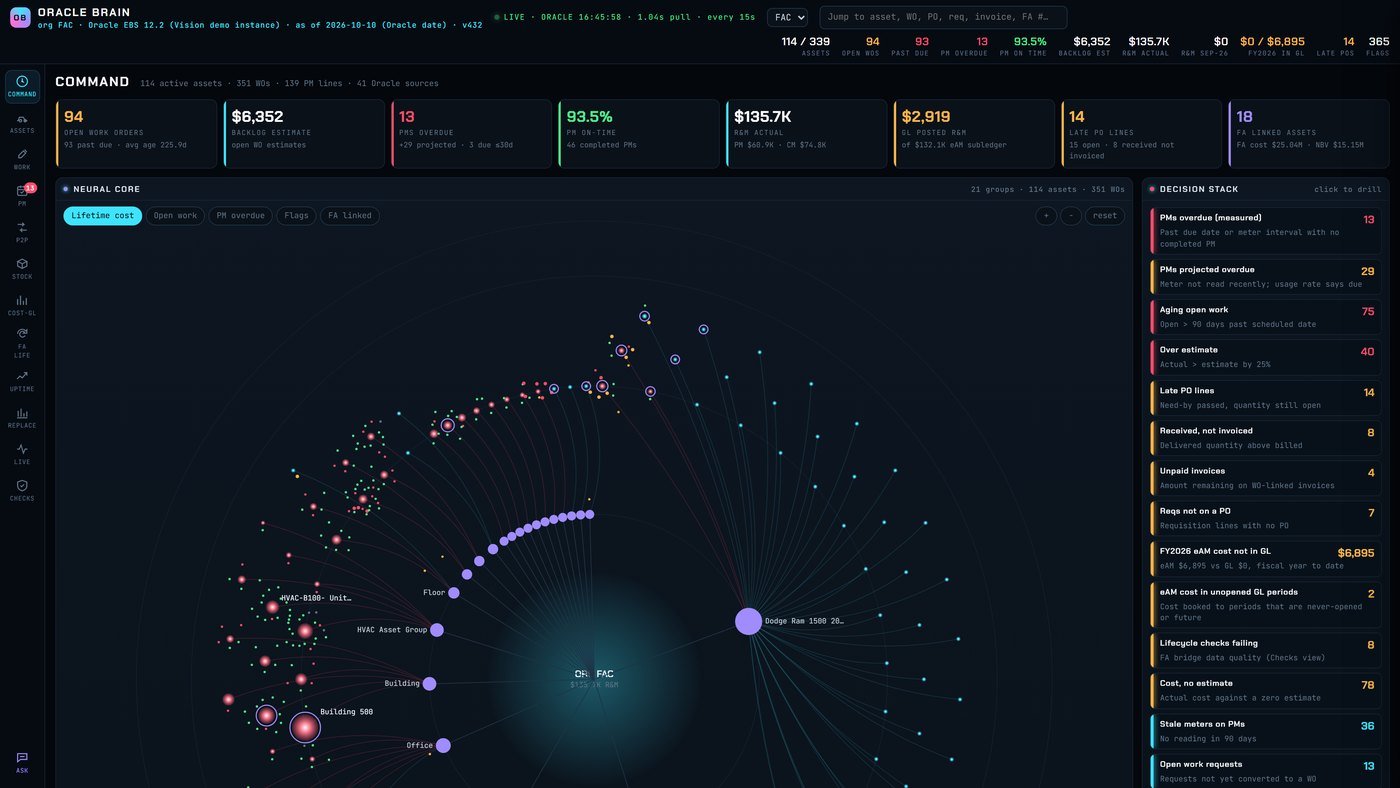
The Command view is the starting point. The neural core maps every asset and group, and the decision stack ranks what needs attention: overdue PMs, aging work, late purchase orders, invoices on hold, and cost that has not reached the general ledger. Every asset is clickable; one drill-down brings together its work orders, maintenance cost, PM schedule and fixed asset record.
What it watches
Work
Open work by age, what is past its scheduled date, and where the backlog sits by asset group. Open any work order to see its operations, requests and cost.
Preventive maintenance
Compliance, what is overdue, and what is coming due, built from the PM schedules in Oracle rather than a separate spreadsheet.
Procure to pay and stock
Each requisition followed through purchase order, receipt and invoice, with late orders and invoice holds flagged. Stock shows material requirements and what is on hand for maintenance.
Cost and GL
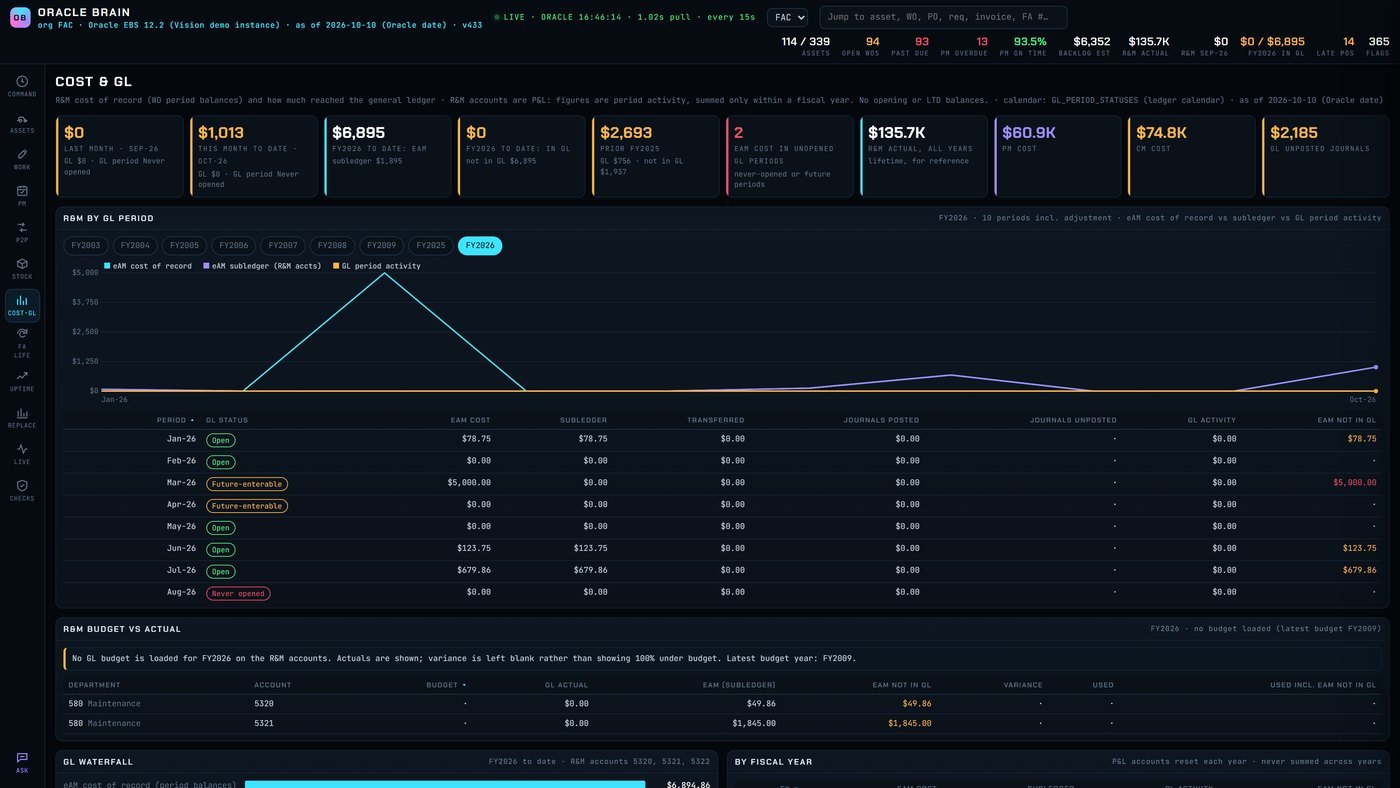
Repair and maintenance spend by fiscal year and period, never as a running lifetime balance. The maintenance subledger is compared with the general ledger, showing exactly what has not posted. Budget versus actual is by department, and a year with no budget loaded says so.
Fixed asset lifecycle
Capital, depreciation by fiscal year, life added by rebuilds, and total cost of ownership, framing keep, rebuild or replace on the numbers. It never assumes an input it does not have.
Uptime
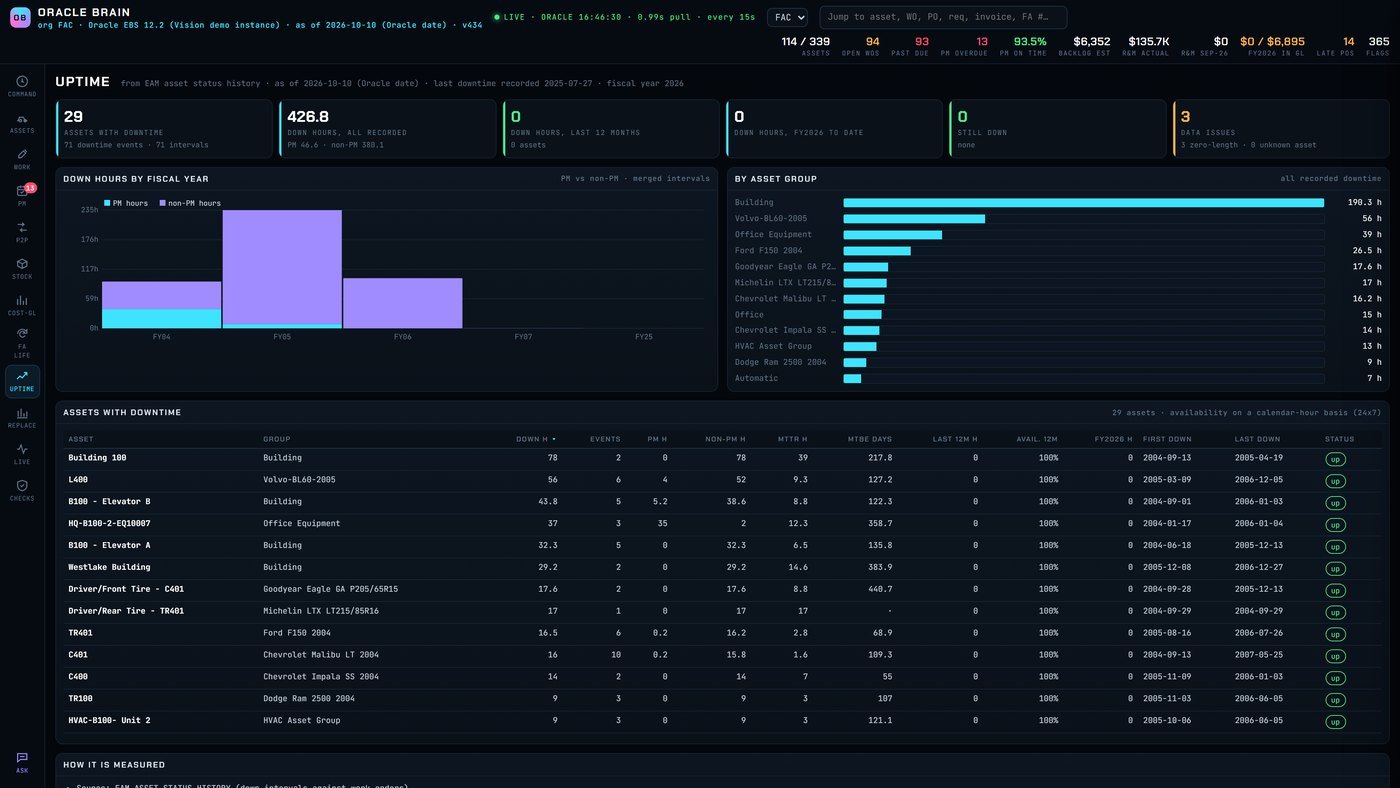
Oracle's asset status history turned into availability, mean time to repair, and downtime split between PM and non-PM work. In the demo data that is 426.8 hours across 29 assets, tying to Oracle within a tenth of an hour.
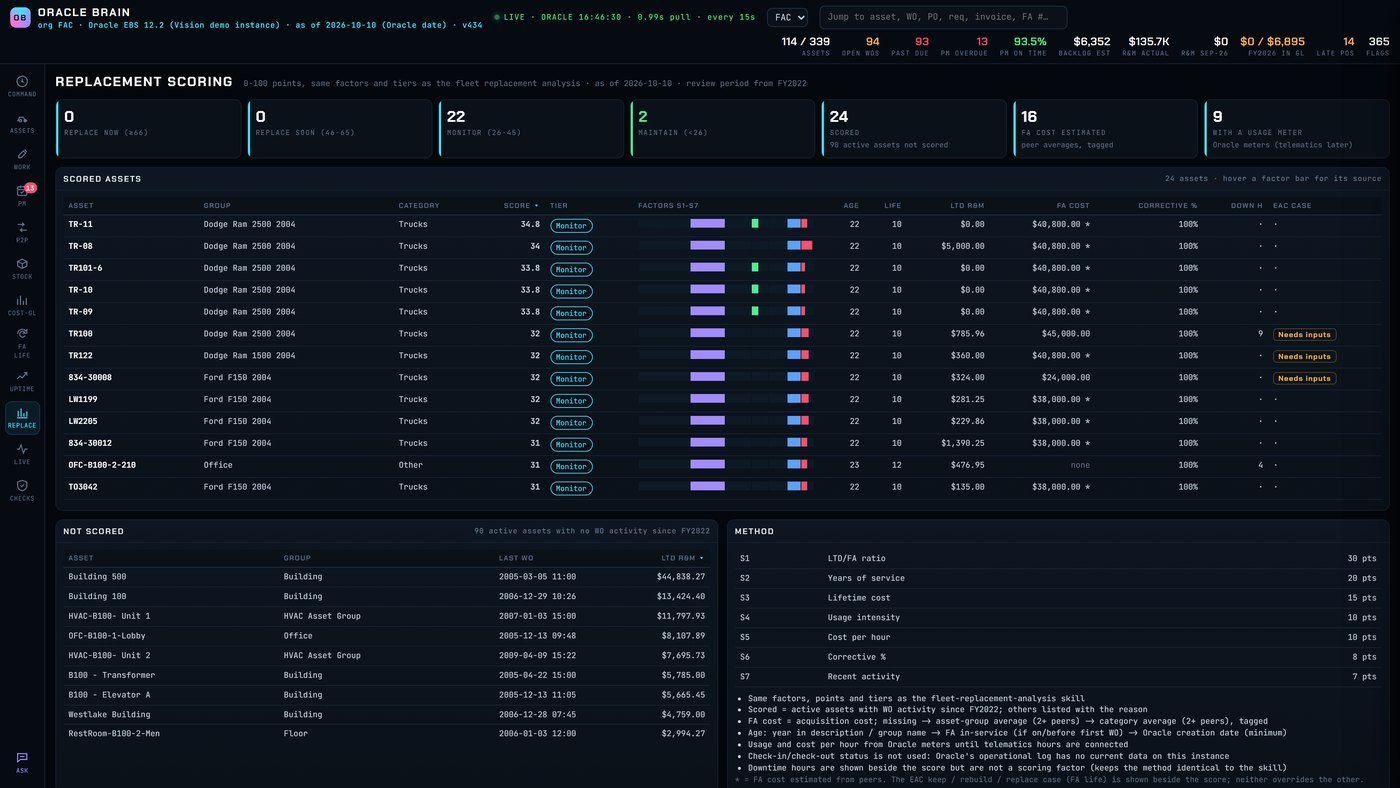
Replacement scoring
Each active asset rated 0 to 100 on seven weighted factors, from lifetime repair cost against purchase cost to age, usage and recent spend, landing in Replace Now, Replace Soon, Monitor or Maintain.
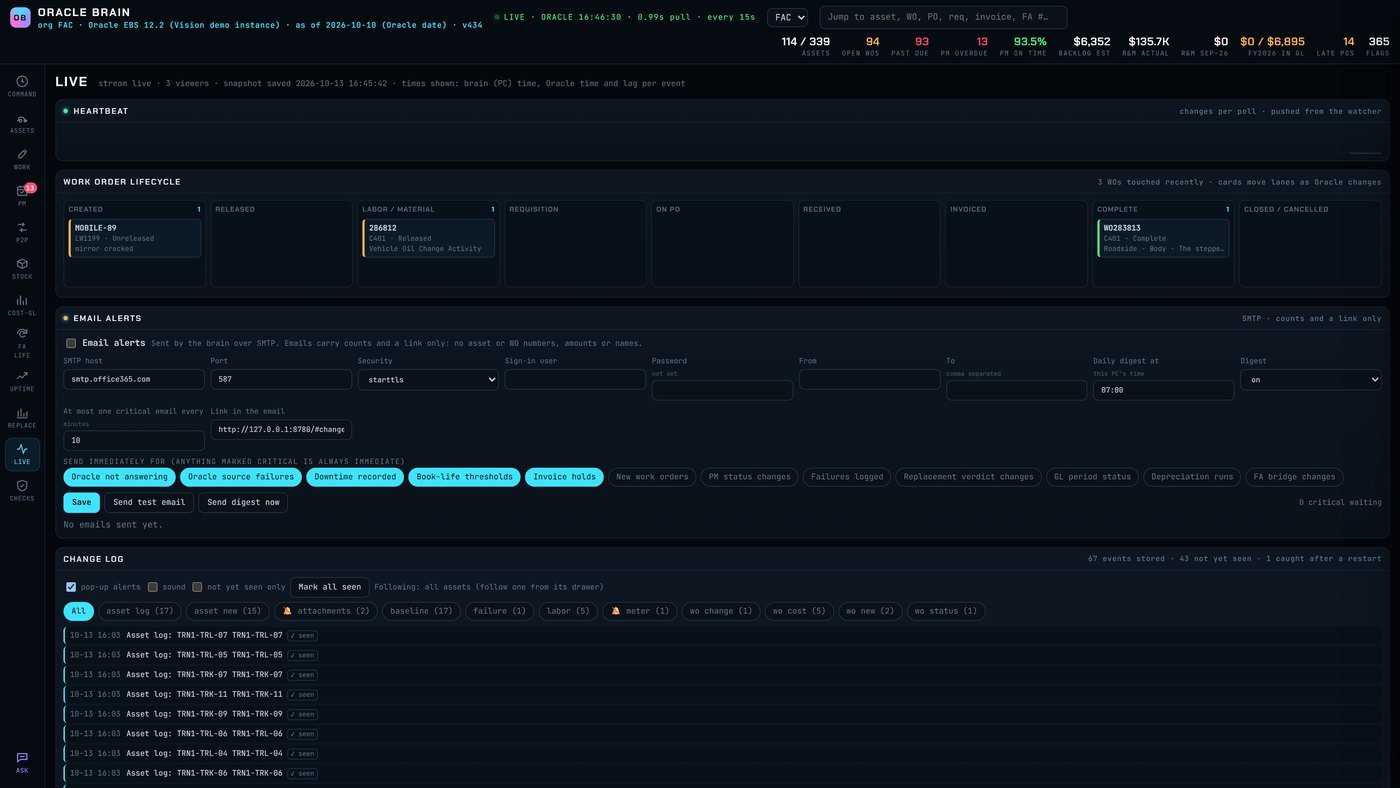
Live and Checks
Each change in Oracle becomes an event you can acknowledge, mute or follow. Email alerts carry counts and a link only. Checks reconcile totals across work orders, the subledger, the ledger and fixed assets, and flag anything that does not tie.
Ask the Brain
You can simply ask. A model running on the same PC pulls what it needs from the live data, and a validator checks every figure in the answer before you see it. In the demo it ranks downtime by asset and splits PM from non-PM in about thirty seconds, with fifteen of fifteen figures traced to their source.
Built to be trusted
- Read-only toward Oracle. It watches; it never writes back.
- Local by design. It runs on one PC, its AI runs locally, and nothing leaves that PC except an optional alert with counts and a link.
- AI is advisory. It never overrides the calculated answer.
- Tested and reconciled. Each release is checked with automated tests and reconciled against Oracle, and every number traces back to its source.
What is next
- A read-only production connection.
- Telematics hours feeding usage and cost per hour.
- Replacement inputs by asset group.
- Alerts switched on for the people who need them.
Limits
- The figures in this paper and in the walkthrough come from the Oracle EBS 12.2 Vision demo instance.
- Production use needs a read-only connection to your own Oracle instance.
- Answers from the AI are advisory; the calculated figures are the record.
Next step
Tell me about the work you want to make easier. I’m Joey McDougal, and I build practical tools around the way people work.